Data Analysis and Machine Learning
My experience with data analysis spans causal inference, modeling, and forecasting. Some of the projects I have worked on include identifying the necessary growth in our subcontractor network to meet organizational goals, forecasting saved energy based on year to date data, and performing hypothesis testing to identify the presence of exterior effects. In machine learning, I have become familiar with algorithms such as K-Nearest Neighbors, Decision Trees, Logistic Regression, and Random Forest.
Data Visualization
In a world driven by complex systems that are largely inaccessible without relevant expertise, I pride myself on presenting broad trends in intuitive ways through research and visualization.
As a data specialist with Energy Trust of Oregon, I used Power BI (DAX) to create dashboards that intuitively communicate the status of data quality issues throughout their data warehouse. I worked extensively with relational databases to gather metrics from multiple tables in doing so.
I have also found opportunities to use data visualization in Economic Development. During my internship with the International Development Group (IDG), we were tasked assisting in the construction of a series of highways in Southern Niger. This project would provide tangible benefits for years to come in a region hard pressed by issues including terrorism and extreme poverty.
For our part, we were tasked with writing a baseline data report so that we could track the effect of our efforts on road usage statistics. I was responsible for creating visuals in Excel, clearly defining relevant metrics like gender and age distributions in comparison to the local population.
Databases
Working on data quality issues for Energy Trust of Oregon, I became intimately familiar with the structure of their relational databases, as well as different means for accessing it. I used Microsoft SQL Server and R to access the data in a tabular format, writing queries for pulling it into Power BI for display. This experience has given me confidence when working with relational databases.
Data Analysis/Research
I am passionate about my expertise in using data to help informed decision-making and research.
As an intern with the International Development Group, I fulfilled a variety of roles involving data analysis. As a project for the summer, I researched the Barriers to Business in the Western Balkans, communicating my findings to the rest of the company both through a written report and a virtual presentation. This undertaking focused on using data from the World Bank to accurately describe issues with private sector activities on the ground.
As a fiscal note analyst with the Washington State Department of Commerce, I was responsible for gaining accurate estimations of the impact state legislation would have on local governments. To do this, I consulted relevant public agencies and institutions for estimates on how bills would affect their budgets. I then summarized this information into documents that informed both policy makers and the general public.
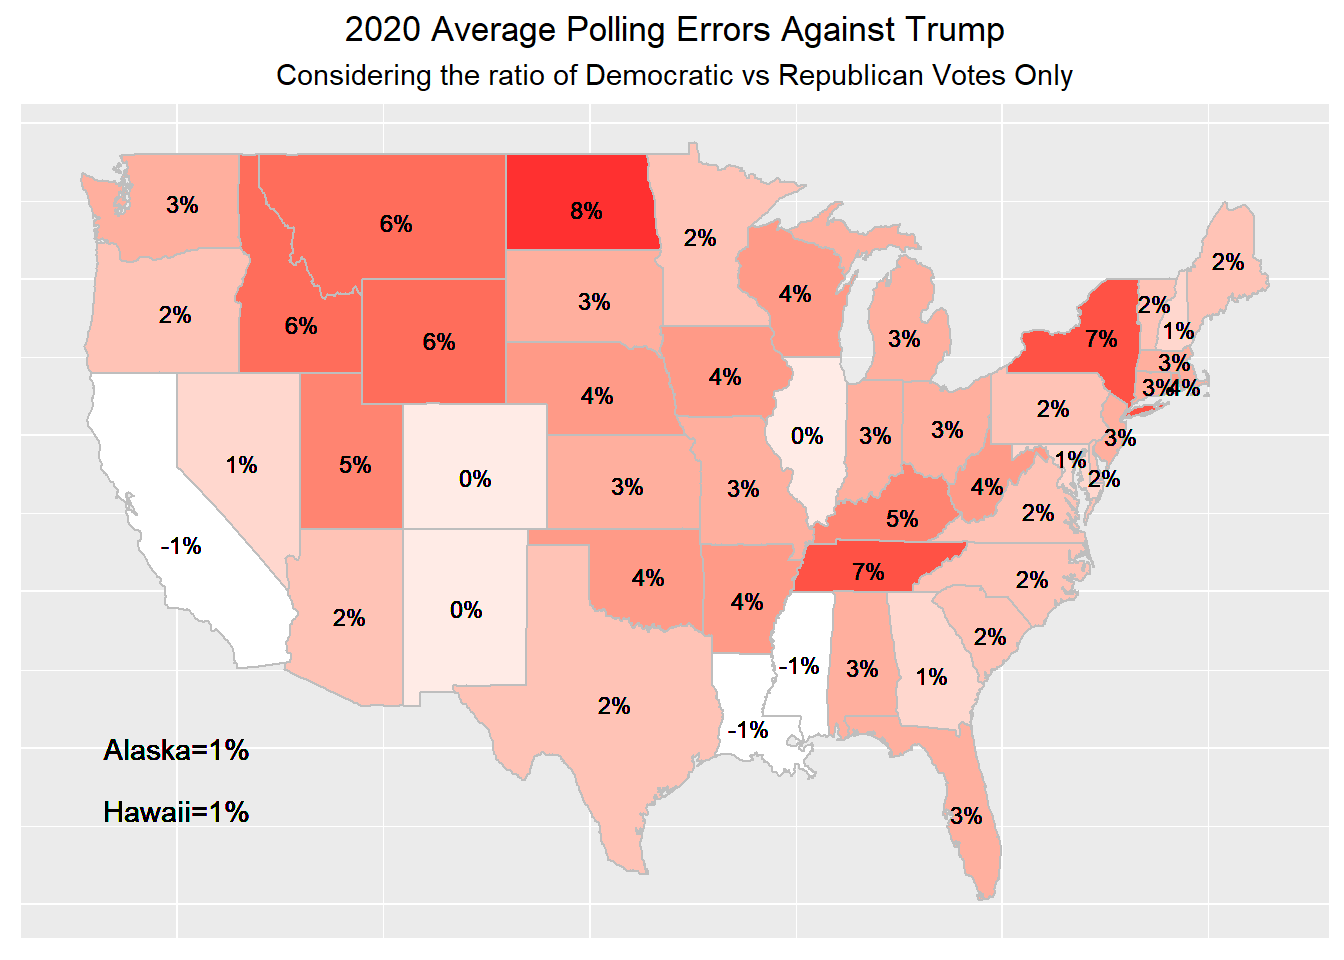
Even in the classroom, I found opportunities to put theory to good use. For my Master's degree, I wrote an econometric report deconstructing the impact of COVID-19 lockdowns on international trade intensity. I used a fixed effect gravity model to identify a 25% drop in export integration and 8% drop in import integration under quarantine. I also wrote a blog post testing whether the polling errors of the US general election were significantly different between 2016 and 2020.
My academic curriculum also included exposure to advanced econometrics and machine learning. Specifically, I had the opportunity to work with the TidyModels R package, where I became familiar with the implementation and theory behind models. I coordinated with my classmate Jonas Bowman to complete a project using different models to predict the selection of yearly NBA AllStars with seasonal statistics. I have also completed several projects on my kaggle profile, using machine learning to predict housing prices and titanic survivorship.
Even before landing my first job, I was able to use my skills to help a local non-profit, ShelterCare, in interpreting baseline data from their initial workplace surveys. Here, I visualized the data and provided a report that outlined industry standards for using employee satisfaction surveys.
Data Collection/Cleaning
I am well versed in data scrubbing and wrangling. Having worked with the Tidyverse and Data.Table packages in R, I am confident that I can adequately tackle the cleaning, reformatting, and standaridization of datasets.
At Energy Trust of Oregon, I was responsible for cleaning data on utility customer information. This involved keeping a record of differently formatted datasets aqcuired over the years, then writing an R script capable of generating a single dataset for use by others in the organization.
Another relevant adventure was my time with A Family for Every Child. According to the Department of Health and Human Services, there are around 400,000 children in foster care in the United States. (https://www.acf.hhs.gov/sites/default/files/documents/cb/afcarsreport28.pdf) Under the supervision of the volunteer coordinator, I led a project to improve Child and Family Matching Events. These seminars, which became virtual due to the COVID-19 Pandemic, were aimed at connecting foster children and potential adopting families. To help make these virtual events a success, I:
- Updated the email templates used to market the events.
- Monitored data on the open and click rates of our email-marketing templates.
- Wrote survey questions to monitor attendee experiences through ConstantContact.
- Collected data on the attendance and outcomes of matching events in SalesForce.